Nederlandse data-visualisatie op Times Square
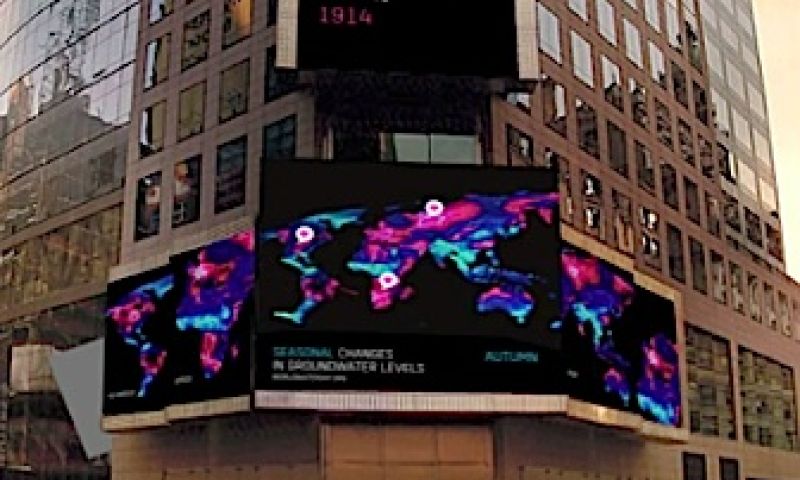
Richard Vijgens data-visualisatie van grondwaterniveaus komt op het grote scherm op Times Square in New York.
'Seasonal and Longterm Changes in Groundwater LevelsRichard VijgenGRACE satellieten
Heads UP! data-visualisatiewedstrijdTimes Square
ArtEZ hogeschool
<object data="http://vimeo.com/moogaloop.swf?clip_id=31906324&server=vimeo.com&show_title=0&show_byline=0&show_portrait=0&color=00adef&fullscreen=1&autoplay=0&loop=0" type="application/x-shockwave-flash" height="702" width="400"><param name="data" value="http://vimeo.com/moogaloop.swf?clip_id=31906324&server=vimeo.com&show_title=0&show_byline=0&show_portrait=0&color=00adef&fullscreen=1&autoplay=0&loop=0"><param name="allowfullscreen" value="true"><param name="allowscriptaccess" value="always"><param name="src" value="http://vimeo.com/moogaloop.swf?clip_id=31906324&server=vimeo.com&show_title=0&show_byline=0&show_portrait=0&color=00adef&fullscreen=1&autoplay=0&loop=0"></object>